Week of October 26–November 1, 2026 · Central Okanagan Real Estate
12 Residential Weeks Available · Graham Real Estate
October 26–November 1, 2026 — Month-end, not a market crash
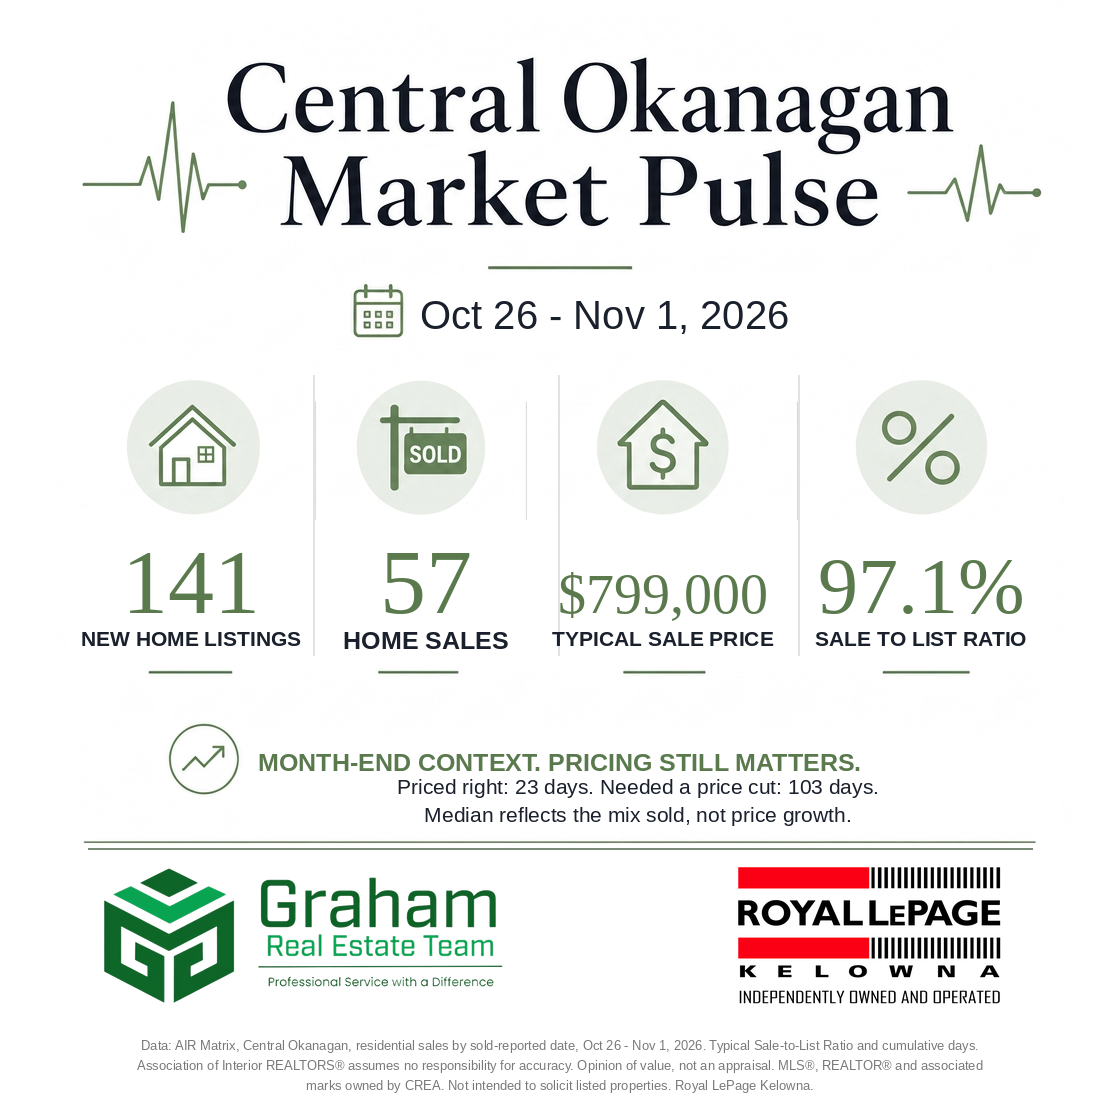
57 home sales and 141 new home listings. Month-end expiries lifted the non-sale rate to 77%, while well-priced homes still sold near asking. The higher typical sale price reflects the mix of homes sold, not price growth.
Residential expiries jumped to 116 as October ended. Many listing contracts finish on the last day of the month, October 31. We saw a similar pattern September 28–October 4: 115 expiries and a 77% non-sale rate. That timing is important context, not evidence of a market crash.
The clearer signal is sales: 57, down from 68 and the lowest week in our stored residential table. The typical sale price rose from $741,000 to $799,000, but 27 of the 57 sales were houses and 17 were $1 million or more. That is a change in the mix sold, not proof that home values increased.
Residential figures only. Days to sell are cumulative; current-listing days are shown separately. Cancelled includes cancel-and-relist. Non-sale rate is expired plus cancelled divided by sales plus expired plus cancelled. Sales ÷ new listings compares activity in the week, not the same group of homes. Pricing groups describe sold homes only, not the prospects of every listed home.
- Home sales
- 57
- Sale-to-List Ratio
- 97.1%
- Days to sell
- 84
Down from 68
Typical residential result
Typical, cumulative
Residential sales · Pricing matters
Priced right. Or reduced later.
Priced right from day one
20 homes
97.5%
of original asking price
23 days to sell
Needed a price cut
20 homes
93.9%
of original asking price
103 days to sell
- At about 97.5%
- $682,500
- At about 93.9%
- $657,300
$25,200 difference · 80 extra days
Illustration only, not a forecast or valuation.
Comparison notes
Using this week’s rounded residential group results. Typical means the middle value. Different homes sold in each group; pricing alone does not explain every difference.
Residential sales · By price
Where buyers bought
57 home sales this week
- Under $500,000
- 17
- $500,000–$750,000
- 9
- $750,000–$1 million
- 14
- $1–$1.5 million
- 10
- $1.5 million and up
- 7
The market by home type
How much choice buyers have right now
Latest complete month: loading. More than six months of inventory generally means buyers have more choice and time.
—
Latest monthly figures
—
Latest monthly figures
—
Latest monthly figures
Residential homes only. Typical means the middle value, not a benchmark for an individual home. The median reflects this week's mix. Sale-to-List Ratio is the median of individual sold-to-list ratios; the overall ratio is separate.
12 residential weeks available. Month-end context matters.
Month-end expiries rose to 116. Home sales eased to 57; the expiry spike alone is not a market crash.
Observed residential weeks only; missing weeks are omitted, not filled in. October new-listing figures are approximate.
| Week | New Listings | Sales | Unsold | Non-sale rate | Expired | Cancelled | Sales ÷ new |
|---|---|---|---|---|---|---|---|
| Jul 27–Aug 2 | 206 | 120 | 168 | 58% | 70 | 98 | 58% |
| Aug 3–9 | 161 | 89 | 90 | 50% | 23 | 67 | 55% |
| Aug 10–16 | 193 | 83 | 117 | 59% | 45 | 72 | 43% |
| Aug 17–23 | 184 | 85 | 125 | 60% | 37 | 88 | 46% |
| Sep 7–13 | 220 | 81 | 96 | 54% | 25 | 71 | 37% |
| Sep 14–20 | 202 | 76 | 111 | 59% | 39 | 72 | 38% |
| Sep 21–27 | 166 | 66 | 94 | 59% | 21 | 73 | 40% |
| Sep 28–Oct 4 | 173 | 64 | 212 | 77% | 115 | 97 | 37% |
| Oct 5–11 | ~175 | 58 | 95 | 62% | 22 | 73 | 33% |
| Oct 12–18 | ~116 | 74 | 109 | 60% | 49 | 60 | 64% |
| Oct 19–25 | 141 | 68 | 111 | 62% | 31 | 80 | 48% |
| Oct 26–Nov 1 | 141 | 57 | 193 | 77% | 116 | 77 | 40% |
Stored AIR Matrix residential weeks only; missing weeks are omitted, never filled. ~ means about. From October 19–25, counting uses method v2; comparisons with earlier weeks need that context. Sales ÷ new listings is not a cohort conversion rate.
141 new home listings, 57 sales, 116 expired and 77 cancelled: 193 came off unsold. The non-sale rate was 77%, compared with 62% last week. Sales ÷ new listings eased from 48% to 40%.
Houses: 27 sales; typical price $1,130,000; typical Sale-to-List Ratio 97.1%; typical cumulative days to sell 80.
Townhomes / half-duplex / duplex: 11 sales; typical price $675,000; typical Sale-to-List Ratio 96.8%; typical cumulative days to sell 77.
Condos: 17 sales; typical price $418,000; typical Sale-to-List Ratio 97.2%; typical cumulative days to sell 108.
Manufactured / park homes: 2 sales; typical price $277,500; typical Sale-to-List Ratio 97.4%; typical cumulative days to sell 108.
Price bands: under $500,000 — 17 sales; $500,000–$750,000 — 9; $750,000–$1 million — 14; $1–$1.5 million — 10; $1.5 million and up — 7.
"Priced right: 23 days. Needed a price cut: 103 days."
Three weeks versus three and a half months.
20 homes priced right from day one sold at about 97.5% of original asking, in a typical 23 days — about three weeks.
20 homes that needed a price cut sold at about 93.9% of original asking, in a typical 103 days — about three and a half months.
17 relisted homes sold at about 96.3% of latest asking, after a typical 190 cumulative days across listings.
On a $700,000 example, that is about $682,000 versus $657,000: about $25,000 and 80 extra days. Compared with last week's $42,000 and 61 days, the dollar gap narrowed while the time gap widened. One week is not a trend.
These are typical results among sold homes only. They do not establish that changing the starting price alone caused the difference, or predict what every listed home will achieve.
Price for today's buyers, not last spring's market.
Only 4 of 57 homes sold at or above asking. 12 sold at 95% of asking or less. Well-priced homes can still sell close to asking, but starting high can cost time.
Sellers whose contracts expired now face a winter relist. We would review current competition and recent comparable sales before choosing a fresh asking price, rather than anchor to last spring.
Ask us how homes in your neighbourhood and price range are selling.
Room to negotiate, not a reason to ignore a well-priced home.
193 listings came off unsold this week. That gives buyers leverage when discussing an expired or relisted home, but those listings are not necessarily available today and cancellations include cancel-and-relist.
Homes that sold still typically achieved about 97% of asking. We would use comparable sales and listing history to shape an offer, not assume every seller will accept a deep discount.
Graham Team Take
We would not read a month-end expiry spike as a market crash. Sales eased to 57, so sellers need to price against today's competition. Among homes that sold, the priced-right group took 23 days versus 103 for homes that needed a cut. Buyers have room to negotiate, but a well-priced home still deserves a realistic offer.
Share this recap
What’s my street doing?
Get a free local report with recent nearby sales, current competition and what buyers are doing around your price range.
Get my street reportGraham Real Estate Team · Royal LePage Kelowna


Board totals: Royal LePage Kelowna Market Snapshot (Association of Interior REALTORS® – Central Okanagan). Residential detail: AIR Matrix, Central Okanagan, sales by sold-reported date, Oct 26 – Nov 1, 2026. Residential figures only. Days to sell are cumulative; current-listing days are shown separately. Cancelled includes cancel-and-relist. Non-sale rate is expired plus cancelled divided by sales plus expired plus cancelled. Sales ÷ new listings compares activity in the week, not the same group of homes. Pricing groups describe sold homes only, not the prospects of every listed home. Market analysis figures are an opinion of value and not an appraisal. NOTE: this representation is based in whole or in part on data generated by the Association of Interior REALTORS®, which assumes no responsibility for its accuracy. MLS®, REALTOR®, and the associated logos are trademarks owned or controlled by The Canadian Real Estate Association (CREA). Not intended to solicit properties already listed for sale. Royal LePage Kelowna, independently owned and operated.
Graham Real Estate Team · Royal LePage Kelowna. Non-sale rate = expired plus cancelled listings divided by sales plus expired plus cancelled. Weekly totals and residential details come from the sources named above.
Get the Market Pulse in your inbox
The Central Okanagan numbers, once a month. Weekly figures are published free on our Market Pulse page. Confirm your email once and you're in.